2018年雅思小作文混合图范文之某市温度与降水
2018-05-16 08:41
来源:新东方在线
作者:
2018年雅思小作文混合图范文之某市温度与降水由长春新东方同步新东方在线整理发布,更多精彩内容,请持续关注长春新东方官方网站及长春新东方学校公众号【ccxdfcn】。

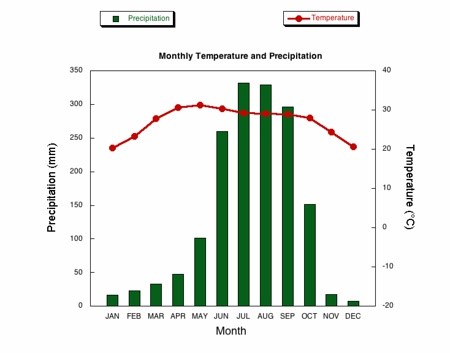
The climograph below shows average monthly temperatures and rainfall in the city of Kolkata
该图表展示一年当中加尔各答市的月均气温和降水。请由此,作答150文章,描述此图。
雅思图表小作文混合图9分范文:
The chart compares average figures for temperature and precipitation over the course of a calendar year in Kolkata.(1句做介绍导入)
It is noticeable that monthly figures for precipitation in Kolkata vary considerably, whereas monthly temperatures remain relatively stable. Rainfall is highest from July to August, while temperatures are highest in April and May.(2句做图表概述)
Between the months of January and May, average temperatures in Kolkata rise from their lowest point at around 20°C to a peak of just over 30°C. Average rainfall in the city also rises over the same period, from approximately 20mm of rain in January to 100mm in May.(3句的细节段1)
While temperatures stay roughly the same for the next four months, the amount of rainfall more than doubles between May and June. Figures for precipitation remain above 250mm from June to September, peaking at around 330mm in July. The final three months of the year see a dramatic fall in precipitation, to a low of about 10mm in December, and a steady drop in temperatures back to the January average.(3句的细节段2)(173 words, band 9)
以上就是本文的全部内容,更多精彩请随时关注新东方长春学校官网。
相关推荐
以上就是本文的全部内容,更多精彩内容,请持续关注长春新东方网。

新东方长春学校官方微信:新东方长春学校 (微信号:ccxdfcn)
最新考试资讯、考试政策解读、真题解析,请扫一扫二维码,关注我们的官方微信!
相关推荐
版权及免责声明
①凡本网注明"稿件来源:新东方"的所有文字、图片和音视频稿件,版权均属新东方教育科技集团(含本网和新东方网) 所有,任何媒体、网站或个人未经本网协议授权不得转载、链接、转贴或以其他任何方式复制、发表。已经本网协议授权的媒体、网站,在下载使用时必须注明"稿件来源:新东方",违者本网将依法追究法律责任。
② 本网未注明"稿件来源:新东方"的文/图等稿件均为转载稿,本网转载仅基于传递更多信息之目的,并不意味着赞同转载稿的观点或证实其内容的真实性。如其他媒体、网站或个人从本网下载使用,必须保留本网注明的"稿件来源",并自负版权等法律责任。如擅自篡改为"稿件来源:新东方",本网将依法追究法律责任。
③ 如本网转载稿涉及版权等问题,请作者见稿后在两周内速来电与新东方网联系,电话:010-60908555。